
Page 264 - AI Computer 10
P. 264
You should always remember that if you want to sort the values in descending order, then you should assign
False value to the parameter ‘ascending’. For example,
df = pd.read_excel(r’F:\Book_list.xlsx’)
df = df.sort_values(by=’Price’,ascending = False)
print(df.head())
This code sorts the list of items in descending order on the basis of price. Thus, you will get the following output:
Matplotlib
Matplotlib is one of the most popular Python packages used for data visualisation.
It has a platform independent library for making 2D from data in arrays. Matplotlib
is written in Python and makes use of NumPy, the numerical mathematics extension
of Python.
Using Matplotlib, we can draw various types of charts and graphs. The data visualisation in the form of charts
and graphs helps us to understand trends and patterns. Data visualisation is a good technique for reasoning
about quantitative information. Some types of graphs that we can draw with this package are given below:
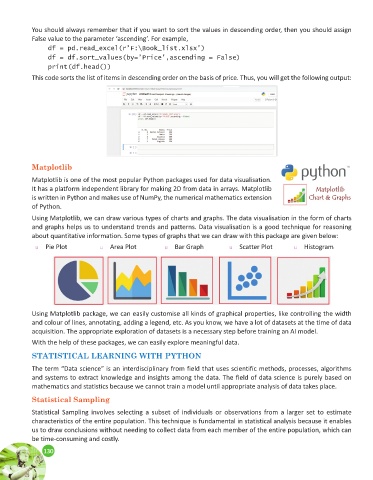
u Pie Plot u Area Plot u Bar Graph u Scatter Plot u Histogram
Using Matplotlib package, we can easily customise all kinds of graphical properties, like controlling the width
and colour of lines, annotating, adding a legend, etc. As you know, we have a lot of datasets at the time of data
acquisition. The appropriate exploration of datasets is a necessary step before training an AI model.
With the help of these packages, we can easily explore meaningful data.
STATISTICAL LEARNING WITH PYTHON
The term “Data science” is an interdisciplinary from field that uses scientific methods, processes, algorithms
and systems to extract knowledge and insights among the data. The field of data science is purely based on
mathematics and statistics because we cannot train a model until appropriate analysis of data takes place.
Statistical Sampling
Statistical Sampling involves selecting a subset of individuals or observations from a larger set to estimate
characteristics of the entire population. This technique is fundamental in statistical analysis because it enables
us to draw conclusions without needing to collect data from each member of the entire population, which can
be time-consuming and costly.
130
130