
Page 276 - AI Computer 10
P. 276
u Modelling Widgets: Modelling widgets allow users to build, evaluate, and deploy machine learning models
without needing extensive programming skills.
• Classification Tree: This widget is used to construct a decision tree classifier.
• k-Means: This widget is used to perform k-means clustering on the data.
• Support Vector Machine: This widget is used to train a support vector machine classifier.
• Logistic Regression: This widget is used to construct a logistic regression model.
u Evaluation Widgets: Evaluation widgets are used to assess the performance of predictive models created
during the data analysis workflow. These widgets enable users to measure how well a model performs on a
given dataset, helping in model selection and validation.
• Test and Score: This widget is used to evaluate the performance of a predictive model on a test dataset.
• Cross Validation: This widget is used to perform cross-validation to assess model performance.
• ROC Curve: This widget is used to plot the receiver operating characteristic curve for binary classifiers.
u Visualization Widgets: Visualisation widgets allow users to explore, analyze, and interpret data visually.
These widgets help in understanding patterns, relationships, and distributions within datasets, facilitating
better insights before or after applying machine learning models.
• Bar Chart: This widget displays data in a bar chart format.
• Heat Map: This widget visualises data using a heatmap.
• Scatter Plot: This widget helps to visualise the relationship between two variables.
The Canvas is the visual workspace where different widgets are dragged and connected with other widgets to
build data analysis workflows.
Orange Data Mining and the AI Project Cycle
Let us learn about the various widgets that are used in the Orange Data Mining tool to perform various tasks at
the different stages of the AI Project Cycle.
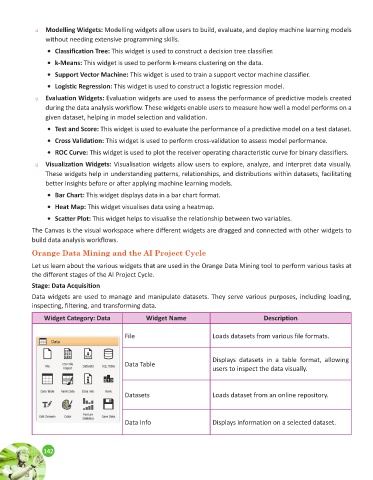
Stage: Data Acquisition
Data widgets are used to manage and manipulate datasets. They serve various purposes, including loading,
inspecting, filtering, and transforming data.
Widget Category: Data Widget Name Description
File Loads datasets from various file formats.
Displays datasets in a table format, allowing
Data Table
users to inspect the data visually.
Datasets Loads dataset from an online repository.
Data Info Displays information on a selected dataset.
142
142